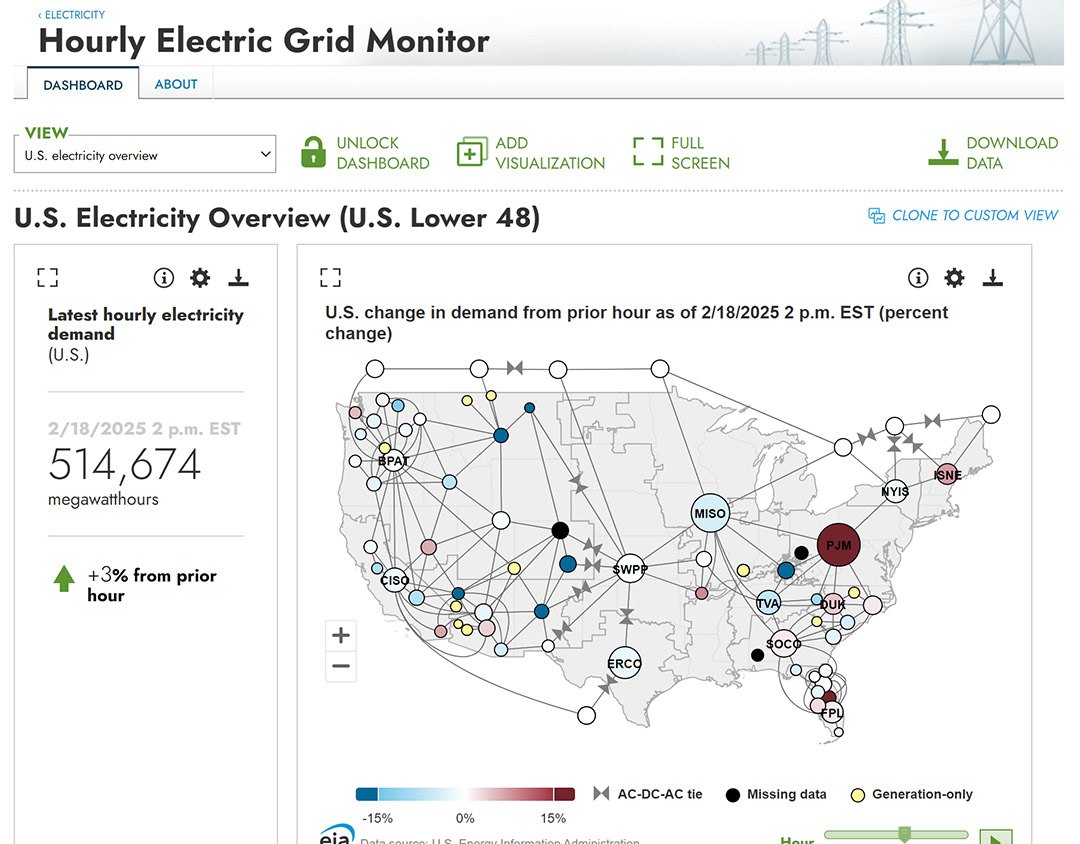
Designing EIA’s Hourly Electric Grid Monitor
1.2M+ views, a national innovation award, and a near-real-time dashboard that transformed public access to grid data
UX/UI design, Branding, Information architecture, Interactive wireframes, Front-end development, Front-end collaboration
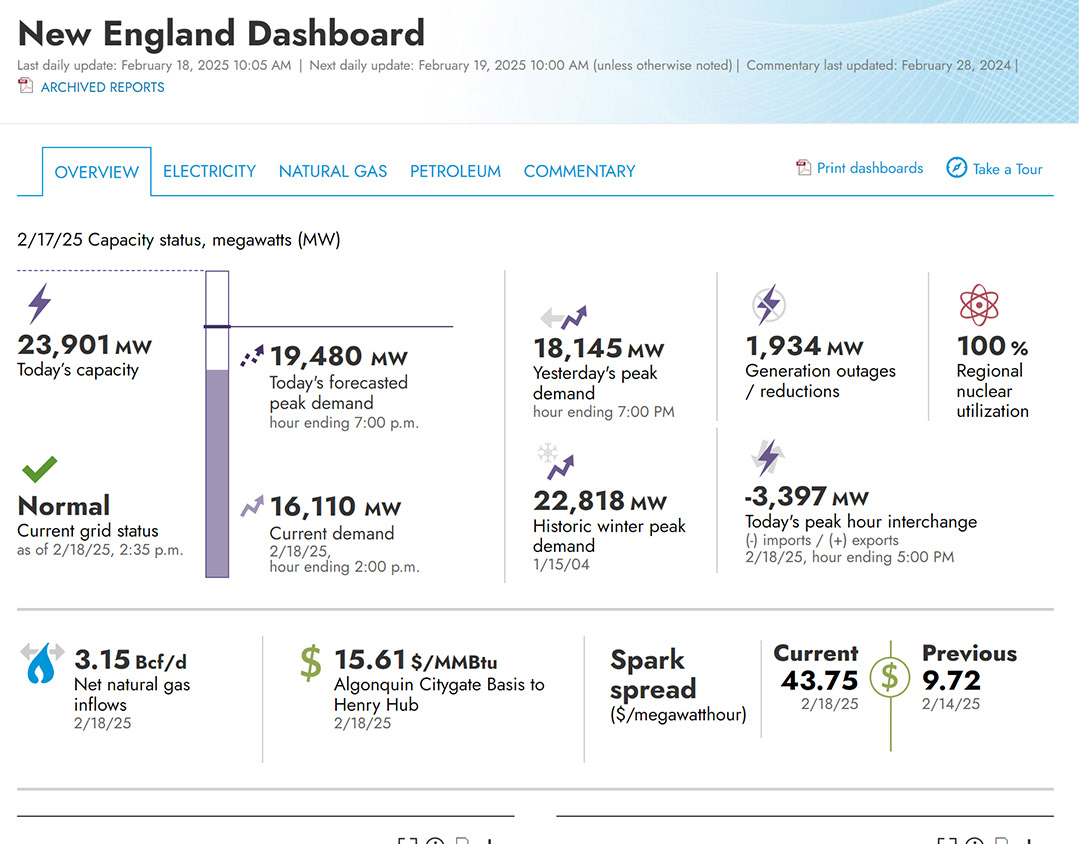
Launching the New England Dashboard in 3 Months
40+ real-time visualizations, a dynamic infographic, and high praise from ISO and FERC—delivered on time under intense constraints
UX/UI design, Branding, Information architecture, Infographics, Front-end development, Front-end collaboration
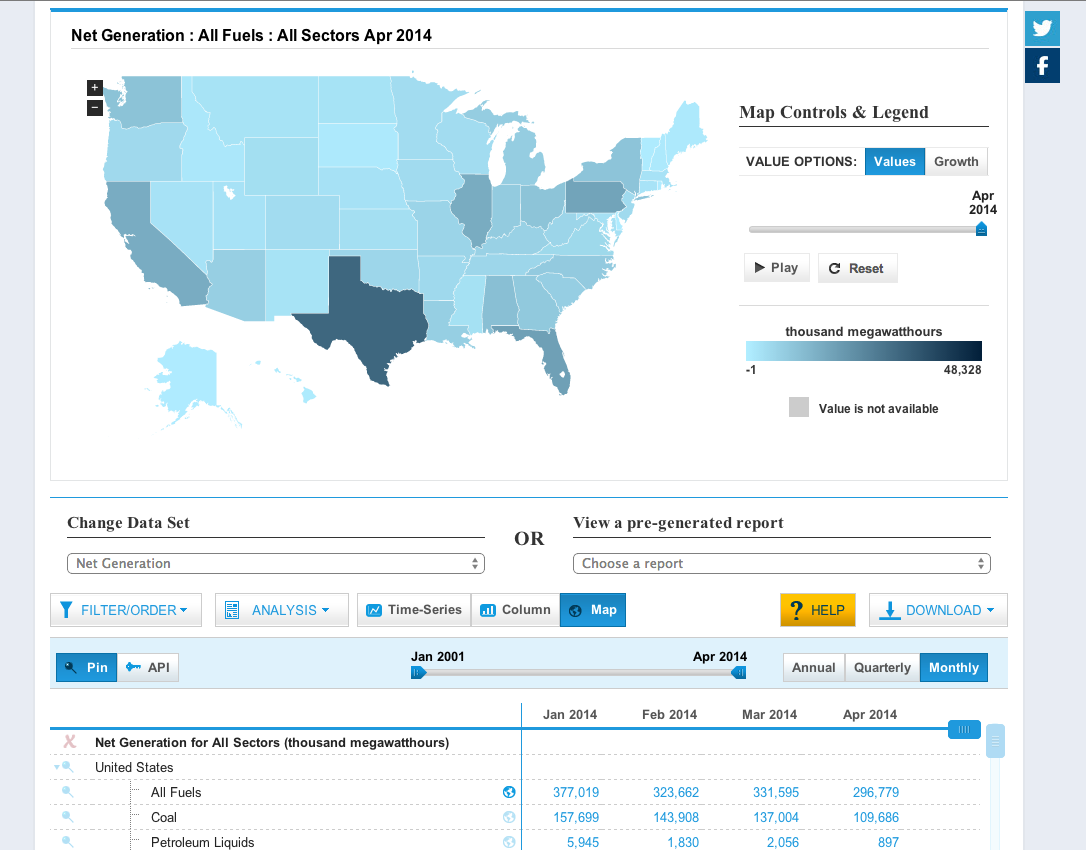
Building the First Interactive Electricity Data Tool
Designed EIA’s Electricity Data Browser—240K+ annual views and a decade of influence on public energy platforms
Research, UX/UI design, Information architecture, Branding, Mockups, Front-end development
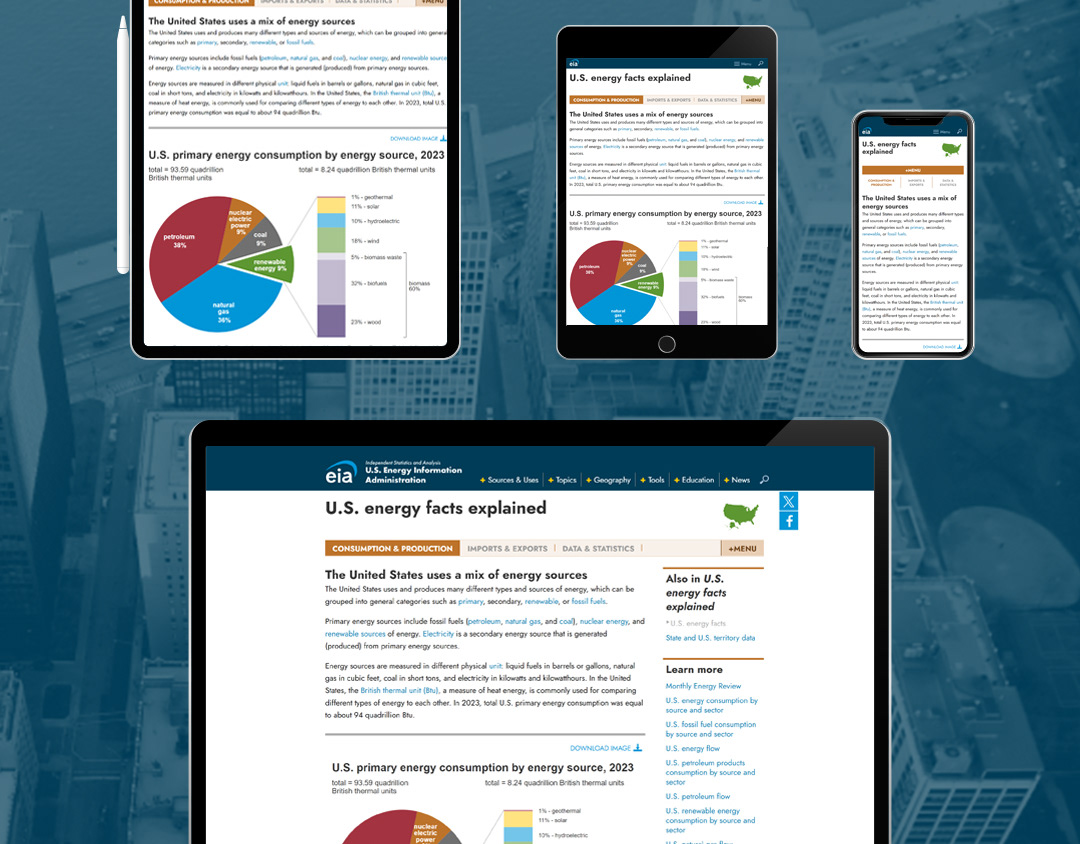
Redesigning Energy Explained for Mobile and Modern Use
8.4M+ views, 89% satisfaction, and a complete overhaul of EIA’s flagship educational resource
UX/UI design, Branding, Mockups, Project management, Front-end development

Redesigning the EIA.gov Homepage After 10 Years
2.25M+ views in the first year—modernizing structure, surfacing high-value content, and aligning with user goals
Research, UX/UI design, Branding, Wireframes, Mockups, Project Management, Front-end development