Client
U.S. Energy Information Administration – the federal agency responsible for national and regional energy data
Context
Before this tool, accessing state-level energy data required navigating dozens of siloed reports. EIA needed a unified platform to bring together data and analysis from across the agency and make it easy for users to explore and compare energy information by state, region, or energy type.
Objectives
• Consolidate 1,700+ data series from 50 sources into one platform
• Create dynamic state-level dashboards and infographics for 56 regions
• Enable side-by-side comparisons and data exploration across states
• Embed charts and maps that stay live and up to date on external sites
• Improve accessibility and contextual understanding through metadata and annotations
• Create dynamic state-level dashboards and infographics for 56 regions
• Enable side-by-side comparisons and data exploration across states
• Embed charts and maps that stay live and up to date on external sites
• Improve accessibility and contextual understanding through metadata and annotations
Strategic Value
I led the UX, IA, branding, and front-end design for this ambitious cross-agency platform, introducing modular navigation, dynamic infographic components, and embedded visualizations. The result is a powerful tool that supports researchers, policymakers, and the public in understanding regional energy trends—while serving as a model for future scalable dashboards.
Results
• 259K+ views from 50K+ users in 2024
• Embedded infographics drove 6,300+ additional views on external sites
• Users praised it as “highly professional” and “exactly what we need”
• Platform architecture enables ongoing expansion and real-time data access
• Embedded infographics drove 6,300+ additional views on external sites
• Users praised it as “highly professional” and “exactly what we need”
• Platform architecture enables ongoing expansion and real-time data access

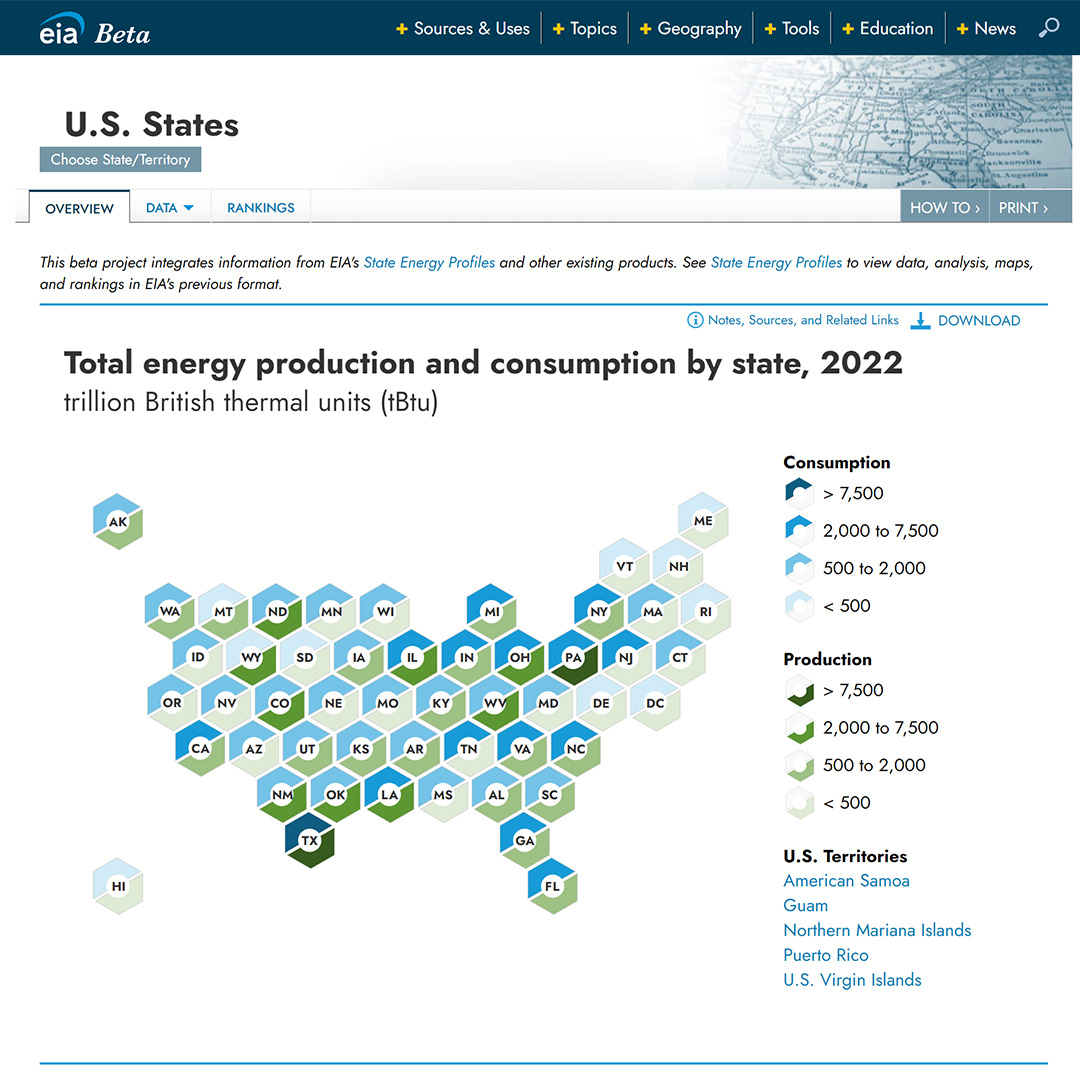
Low-fidelity interactive wireframes

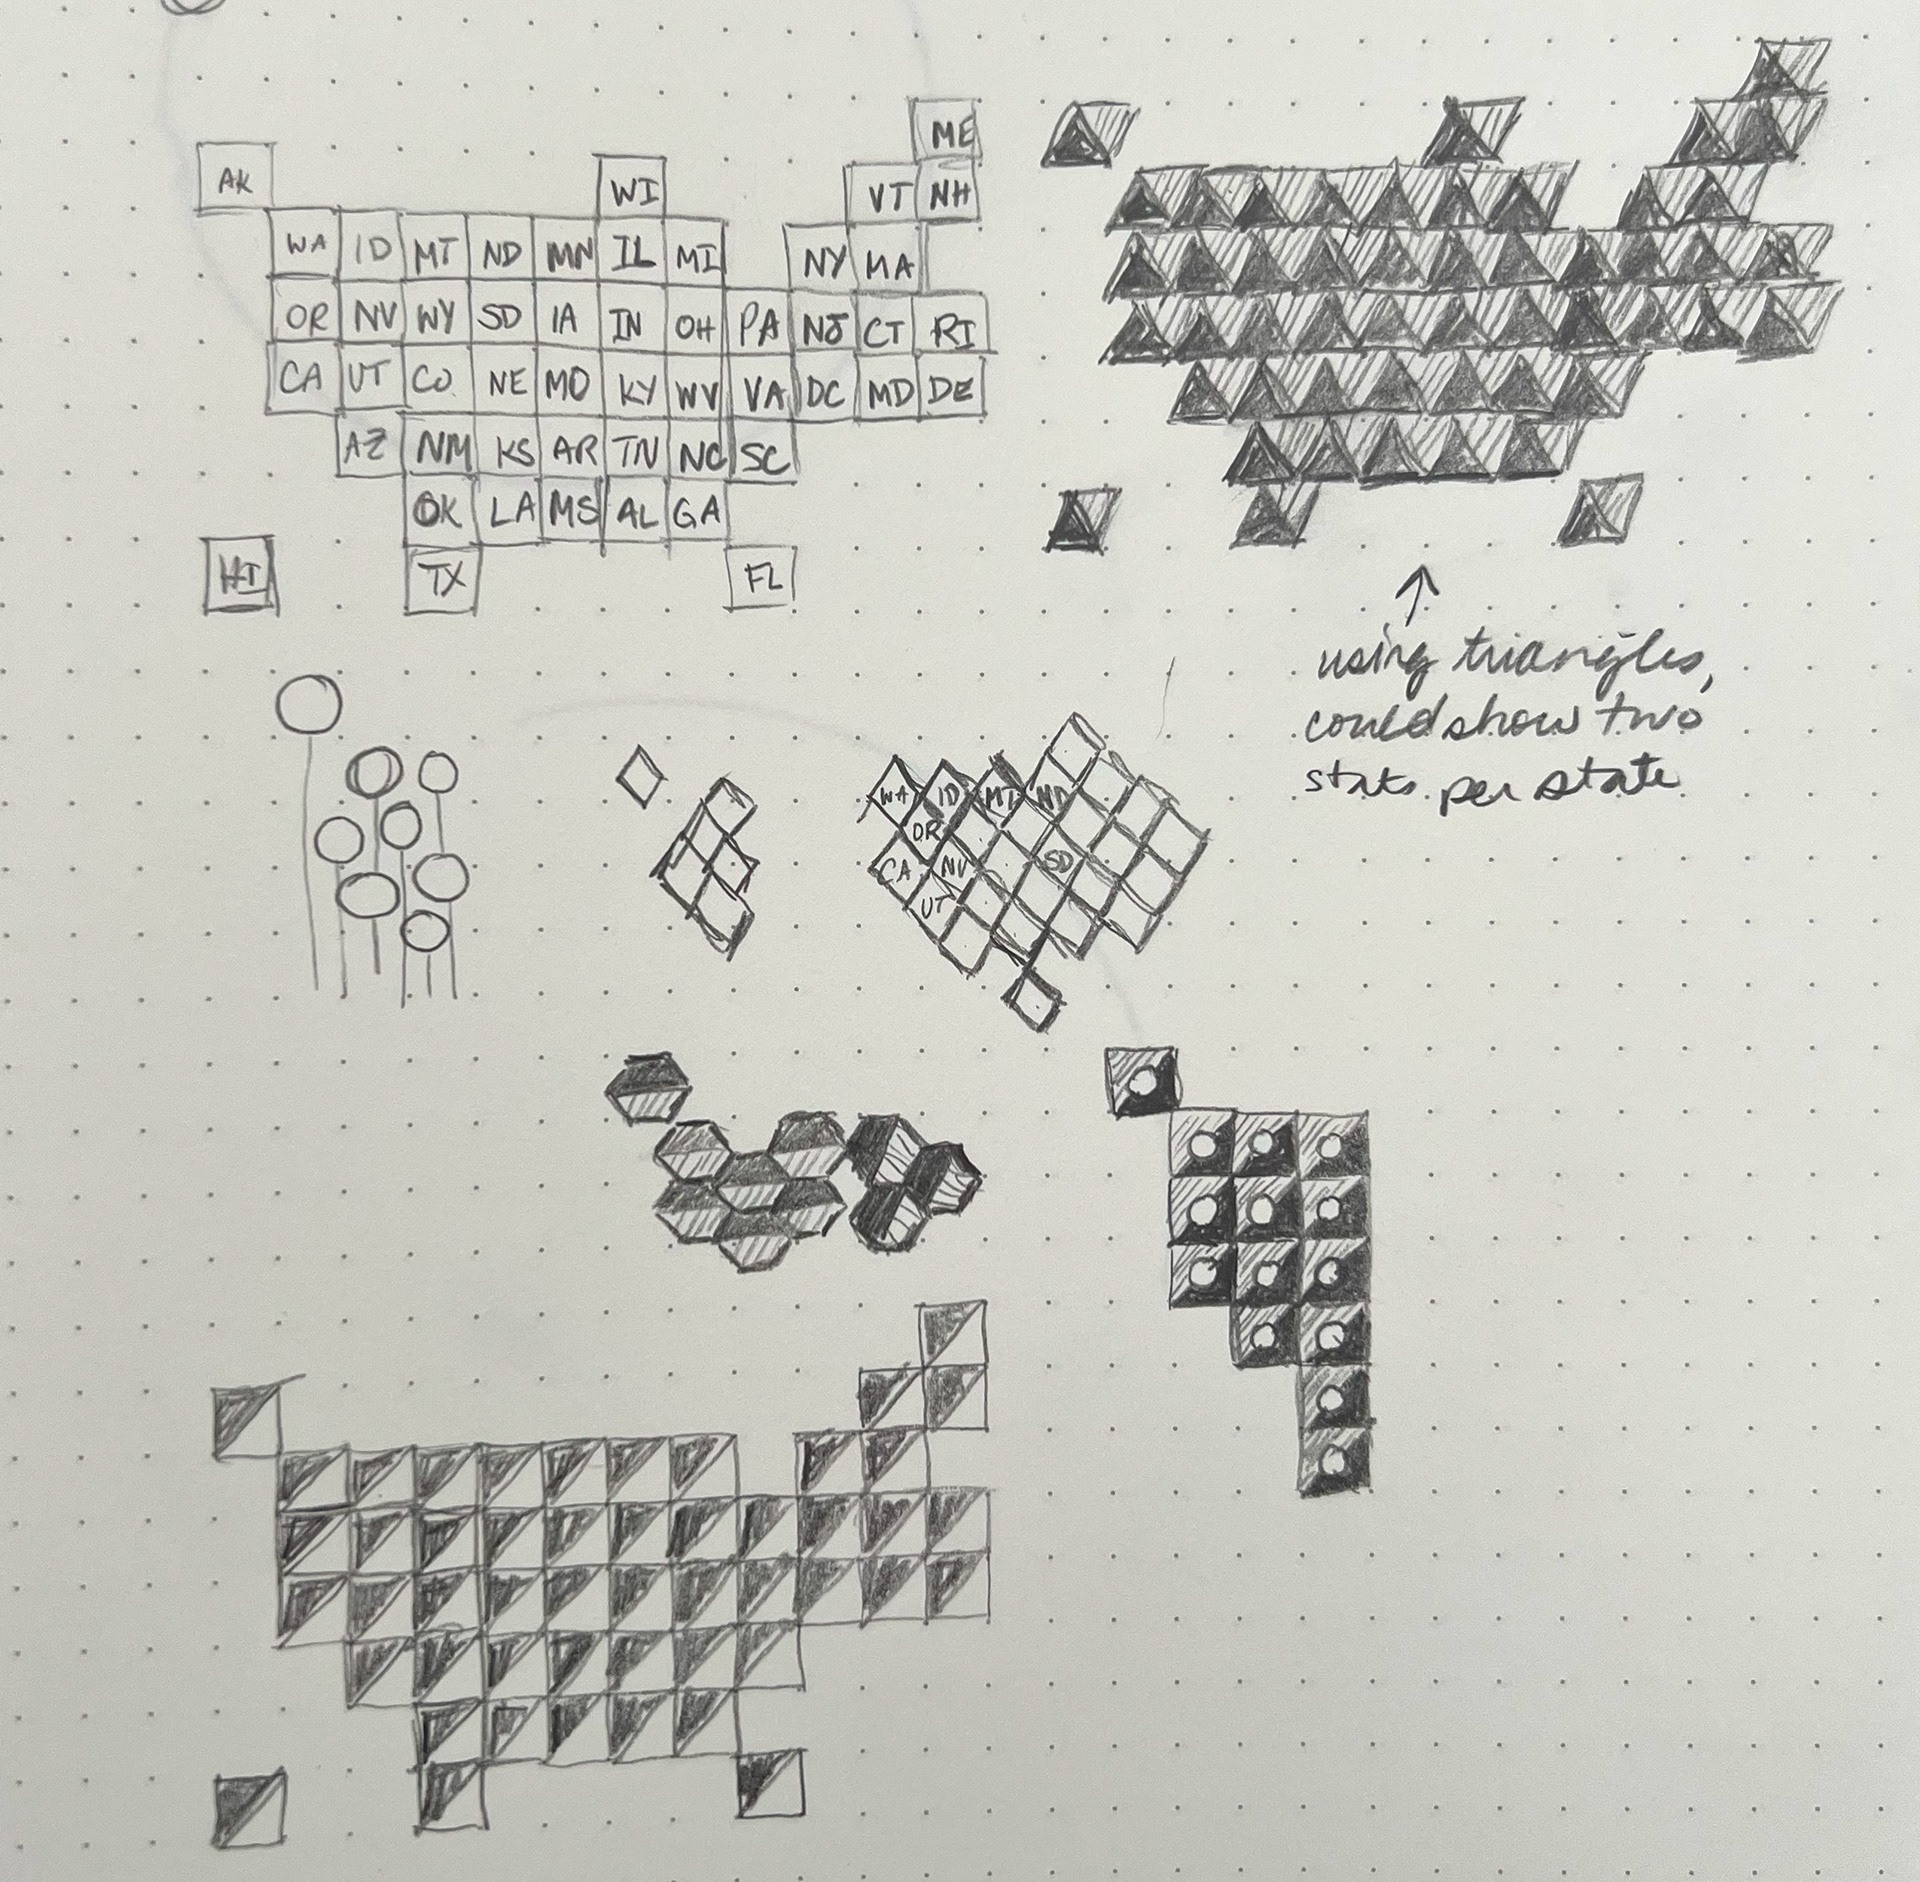
Early sketches for U.S.-level infographic

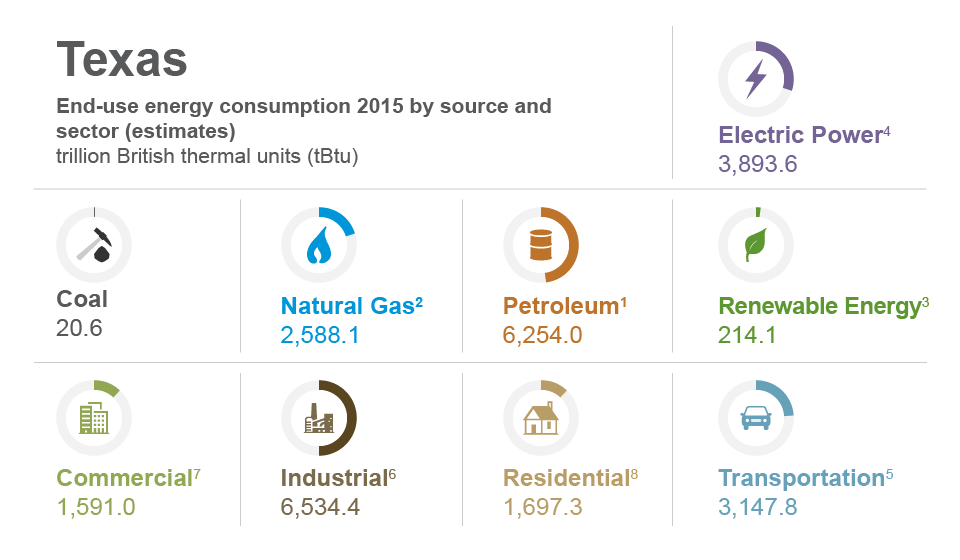
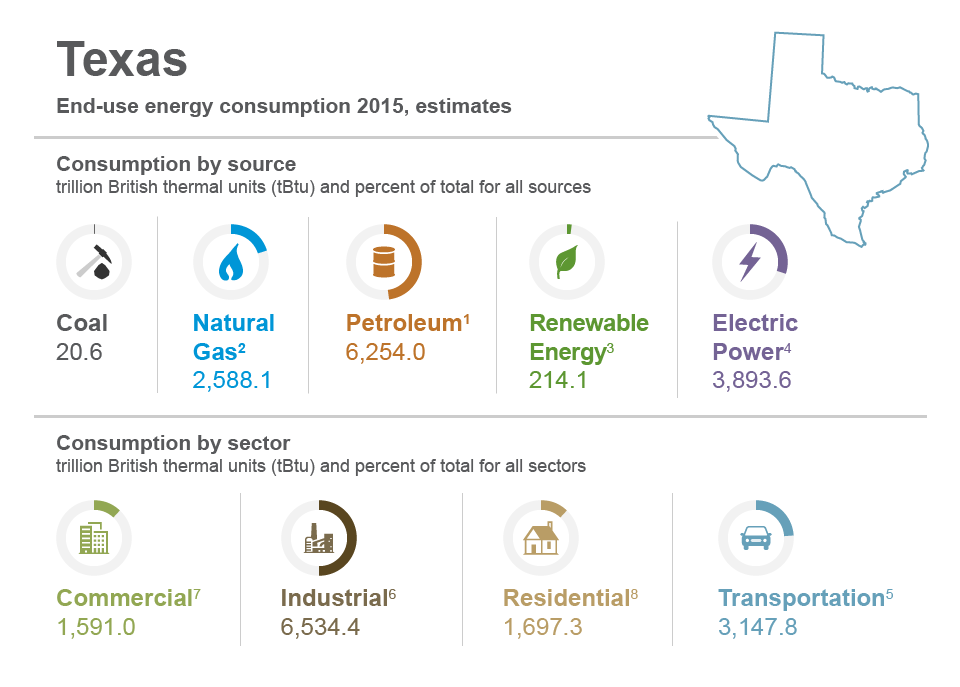
Hi-fidelity mockups for state-level infographics